Data Packages
At Pebble, we work to exceed industry standards for data management. Our statisticians are experienced in preclinical and clinical trials, across all aspects of data management, analysis, and interpretation.
Advanced AI technologies are integrated throughout the data handling stages, enhancing the quality and accuracy of data capture and databasing. Our statisticians use AI systems to select statistical methods and perform analyses, improving the precision of data interpretation.
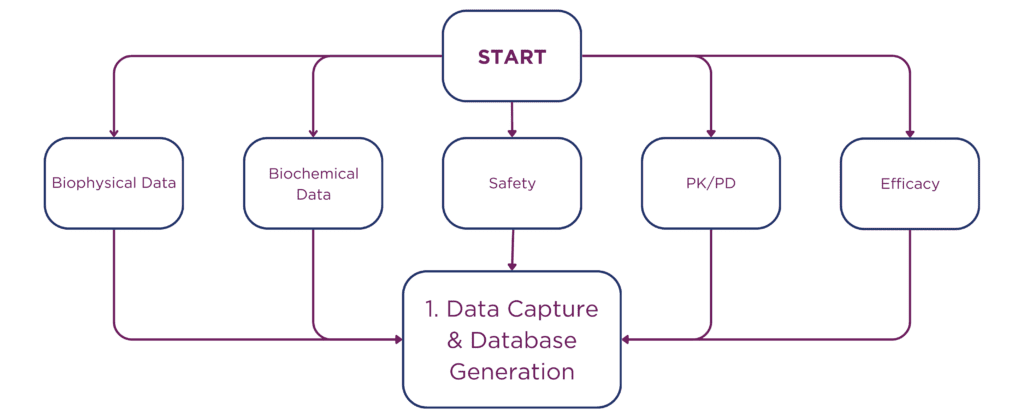
The integration of AI also de-risks human error, assuring that data outcomes are dependable and of the highest scientific standard. Pebble employs a nine-step data processing pathway, ensuring precision from data capture to decision support.
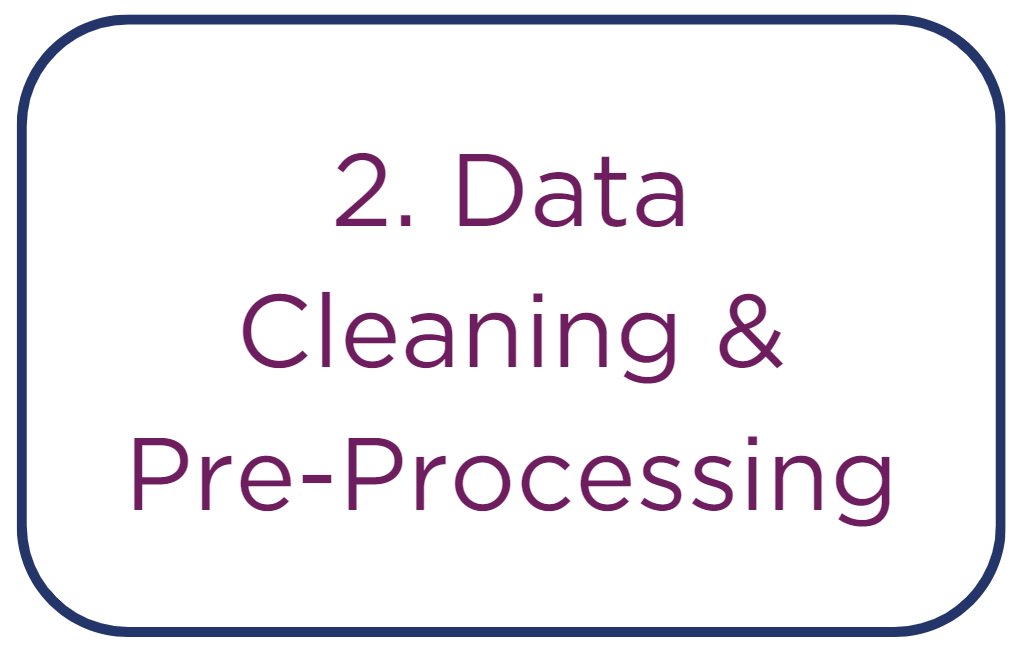
• Cross-verification of data entries against source data to correct any discrepancies or errors.
• Standardization of measurement units across all data to ensure consistency, facilitating comparative and combined analysis.
• Careful alignment and integration of datasets from different sources to maintain a uniform framework for analysis.
• Systematic review of data entries to confirm adherence to expected data ranges and formats.
• Consistency checks between related data points to identify any unexplained variations.
• Confirmation of data completeness and readiness for analysis, with rigorous documentation of any anomalies or data issues encountered and addressed
during the pre-processing stage.
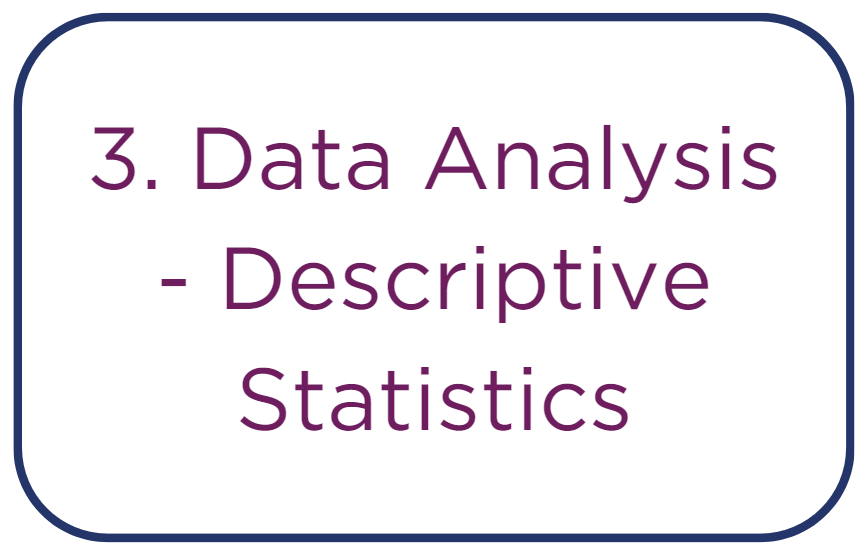
• Calculation of central tendencies, such as the mean for average value, median for middle value, and mode for most frequent value.
• Assessment of data spread through calculation of the range, interquartile range, and standard deviation to understand data variability.
• Generation of basic visualizations, such as box plots for distribution visualization and histograms for frequency distribution.
• Execution of trend analysis to identify consistent patterns or changes over time within the dataset.
• Application of data classification and categorization to group data into segments for targeted analysis.
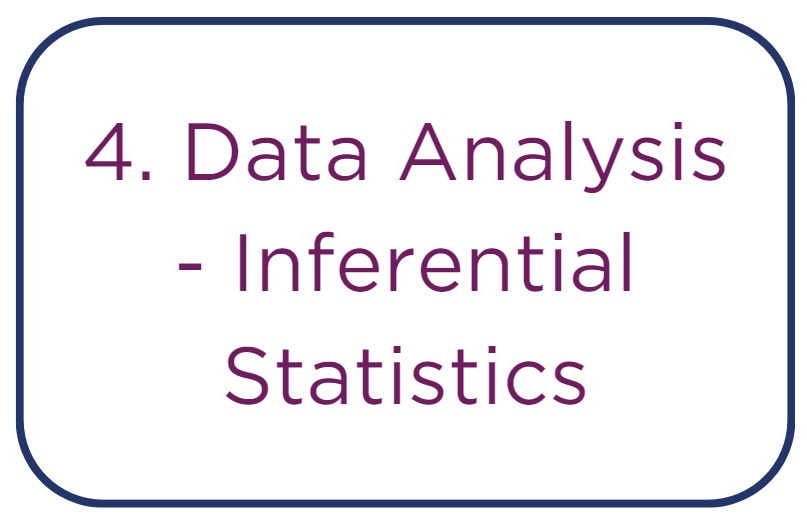
• Conducting t-tests for comparisons between two groups to identify if differences in means are statistically significant, essential for initial drug efficacy
studies.
• Employing ANOVA for comparing means across more than two groups, useful in trials testing multiple dosages.
• Performing correlation analyses, such as Pearson or Spearman tests, to determine the strength and directionality of the relationship between continuous
variables.
• Applying non-parametric tests as alternatives to t-tests or ANOVA when the data distribution does not meet the requirements of normality.
• Using chi-squared tests to investigate associations between categorical variables, which can be crucial for understanding patterns in adverse events.
• Implementing regression analysis to assess the dependency of an outcome on one or more variables, providing insight into potential causal relationships
and the effect sizes of studied drugs.
• Executing multivariate analysis, such as principal component analysis (PCA) and factor analysis, to reduce data dimensionality and detect underlying
variables in multi-marker experiments.
• Carrying out time-series analysis to evaluate trends and cyclical changes in longitudinal data, such as progression of organ function over time.
• Applying survival analysis for time-to-event data, which can be particularly relevant in safety and efficacy studies.
• Utilizing mixed model analysis for data involving repeated measurements, accounting for within-subject variability and complex random effects structures.
• Developing sophisticated regression models that use preclinical data to forecast clinical outcomes. This step is vital for translating preclinical findings into
actionable clinical trial designs and for refining dose-selection criteria.
• Creating detailed pharmacokinetic (PK) models that characterize how the drug is absorbed, distributed, metabolized, and excreted by the body. These
models are critical for optimal dosing strategy development.
• Building robust dose-response models to delineate the quantitative relationship between the concentration of a drug and its pharmacological effect. This is
crucial for establishing the therapeutic window.
• Incorporating advanced machine learning algorithms to sift through extensive datasets, recognizing intricate patterns that may not be evident through
traditional statistical methods.
• Merging datasets from various preclinical studies or different experimental time points, which involves a rigorous process to ensure the compatibility of data
across diverse formats and study conditions.
• Synthesizing findings from disparate analytical approaches, including descriptive statistics, inferential methods, and advanced predictive models. This takes
into account the nuances of each analytical method to form an overview of a drug’s potential effects, safety, and efficacy profiles.
• Conducting meta-analysis to statistically combine results from independent studies. This enhances statistical power and confirms the consistency and
reliability of observed drug effects.
• Utilizing integrated data to support risk-benefit analysis, helping to inform decisions about whether to proceed to human clinical trials. This also allows for
the identification of data trends that may inform future research directions or highlight potential areas of concern that warrant further investigation.
• Crafting detailed reports that not only showcase the statistical significance of the findings but also place them in the context of the study’s objectives and
hypotheses. This involves clear delineation of p-values, confidence intervals, and effect sizes, ensuring that statistical significance is both highlighted and
interpreted in terms of biological relevance.
• Developing a suite of comprehensive data visualizations, such as scatter plots to display correlations or regressions, line graphs to show changes over time,
and heatmaps to represent complex multivariate data. These visualizations aid in making the data more accessible and understandable to diverse audiences,
including non-statisticians.
• Translating technical statistical findings into concise, comprehensible conclusions for stakeholders. This includes summarizing the implications of the results
for the drug/device profile and clearly explaining the potential impact on clinical outcomes.
• Utilizing the compiled statistical findings to inform critical decisions regarding future research directions. This may involve identifying areas where data
suggests promising therapeutic effects or highlighting where further optimization is needed.
• Assessing the viability of transitioning from preclinical models to clinical trials. This includes a review of safety margins, efficacy indicators, and a
consideration of the robustness of the data supporting these findings.
• Considering potential modifications to the drug/device based on a holistic analysis of all data. This can involve adjusting dosages, changing administration
routes, or even re-evaluating target indications based on the safety and efficacy profiles emerged from the data.
Pebble’s approach ensures that each stage of our data process, from initial capture to final analysis, contributes to clear, reliable outcomes that drive scientific and medical progress forward.

